
Introduction
We are excited to announce that Manticore Search starting from 6.2.0 integrates effortlessly with Grafana, the popular open-source data visualization and monitoring platform. By leveraging the default MySQL connector, you can now visualize Manticore Search data in a more dynamic and informative way. This integration brings new possibilities for search performance optimization, trend analysis, and real-time insights.
In the following sections, we will guide you through the process of connecting Manticore Search to Grafana and help you create your first chart.
Step-by-step tutorial
Step 1: Install and Configure Manticore Search
Before connecting Manticore Search to Grafana, make sure you have installed and configured Manticore Search on your server. Follow the official Manticore Search documentation for installation and setup instructions.
Step 2: Set up Grafana
To set up Grafana, follow the official Grafana installation guide.
Step 3: Prepare Manticore Search data to visualize
In the next step, you need to prepare and create tables in Manticore Search, then load them with data that will help us generate charts and visualize them using Grafana. Connect to Manticore using a MySQL client and execute the following queries:
Here is the structure we will use:
CREATE TABLE btc_usd_trading (
id bigint,
time timestamp,
open float,
high float,
low float,
close float
);
Now, let’s add some data to populate the table. Just open your terminal and run following comands:
curl -sSL https://gist.githubusercontent.com/donhardman/df109ba6c5e690f73198b95f3768e73f/raw/0fab3aee69d7007fad012f4e97f38901a64831fb/btc_usd_trading.sql | mysql -h0 -P9306
Step 4: Connect Manticore Search to Grafana
- Log in to your Grafana dashboard and click on “Configuration” (the gear icon) in the left sidebar.
- Select “Data Sources” and click on “Add data source.”
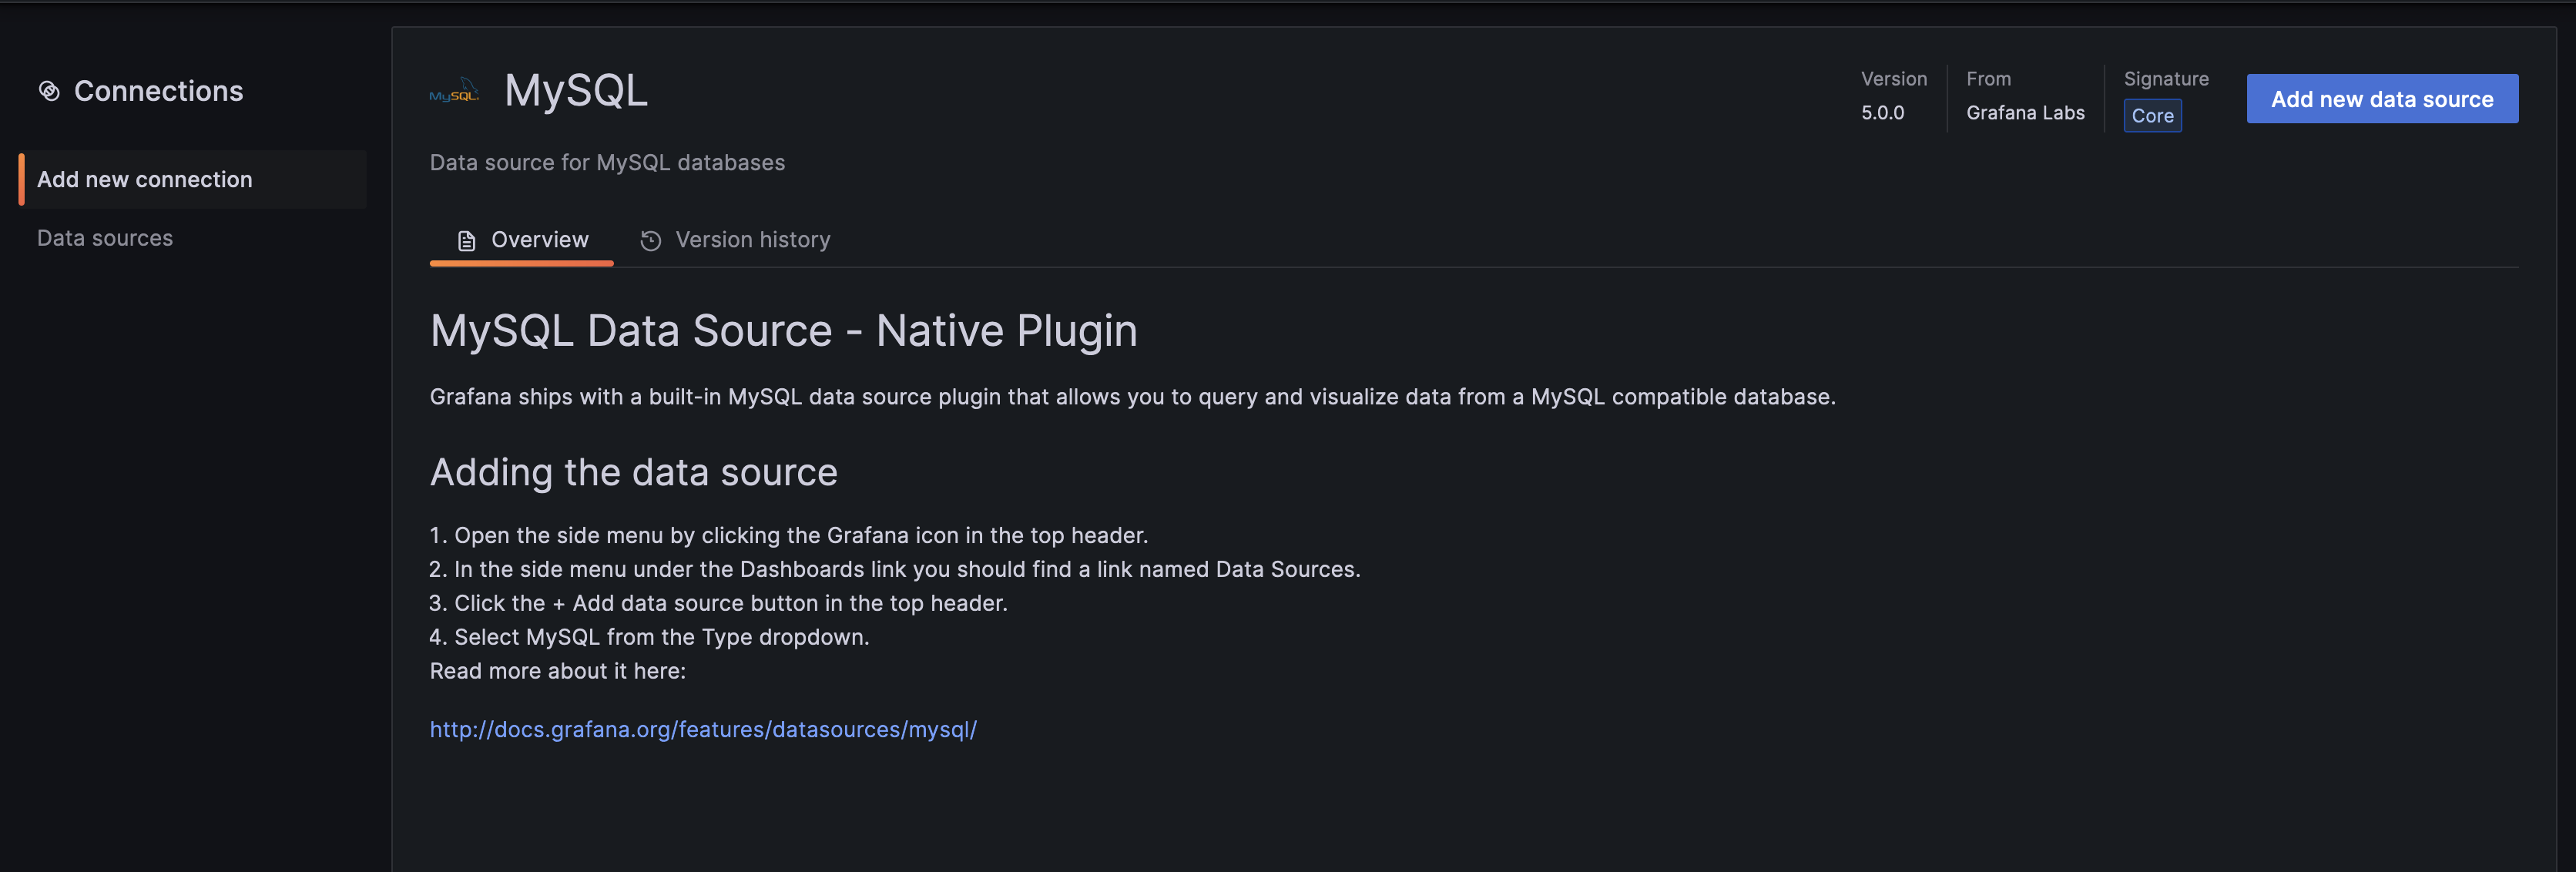
- Choose “MySQL” from the list of available data sources.
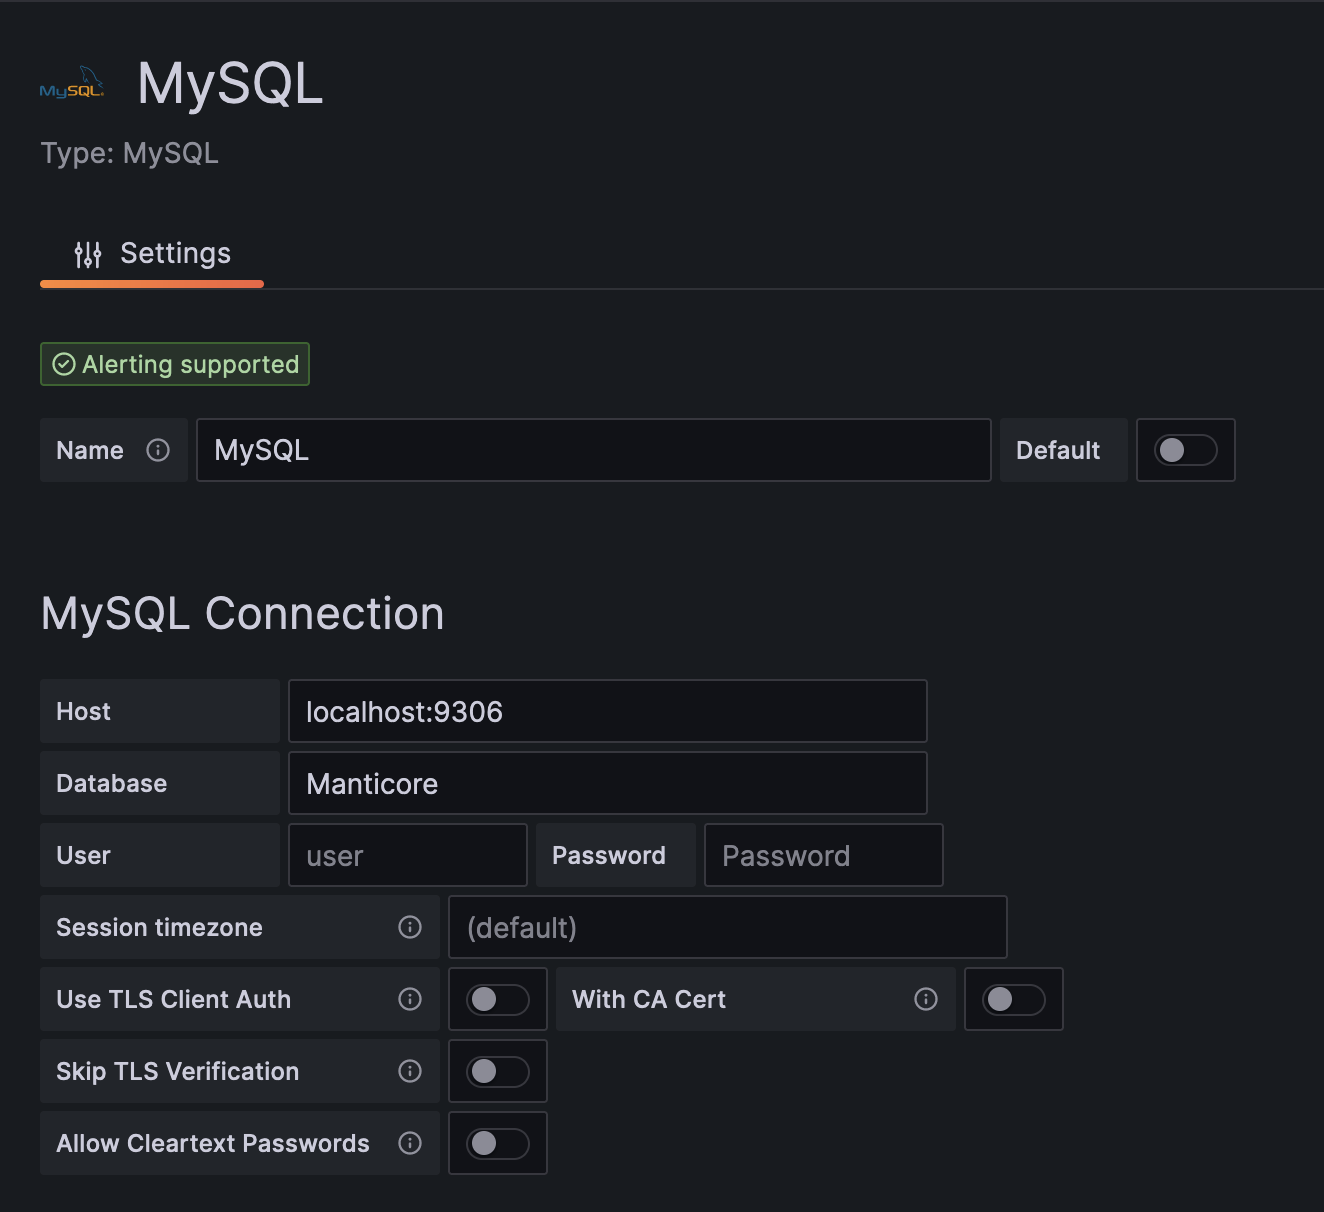
- In the settings page, provide the following details:
- Name: A name for the data source (e.g., “Manticore Search”).
- Host: The hostname or IP address of your Manticore Search server.
- Database: Your Manticore Search database name.
- User: The username with access to the specified Manticore Search database.
- Password: The password for the specified user.
- Click on “Save & Test” to verify the connection.
Step 5: Create a Dashboard and Add a Chart
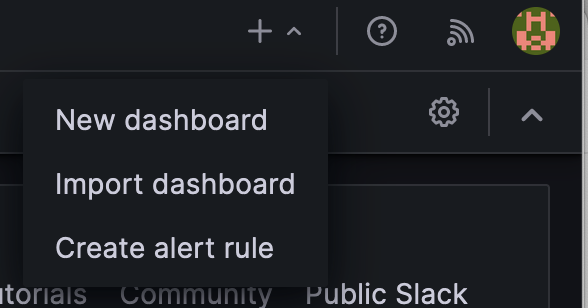
- In the Grafana dashboard, click on the “+” icon in the left sidebar, and select “New dashboard.”
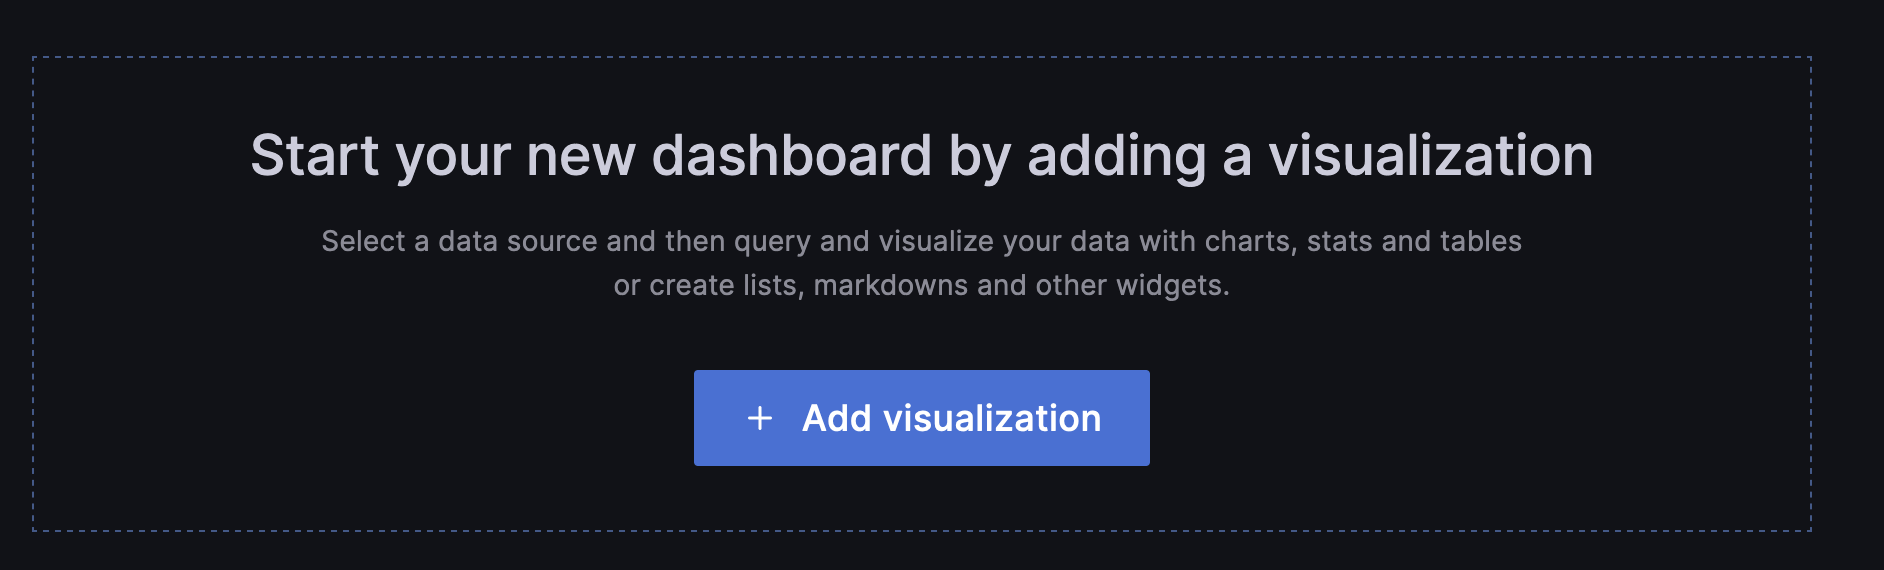
- Click on the “Add visualization” button to start configuring your chart.
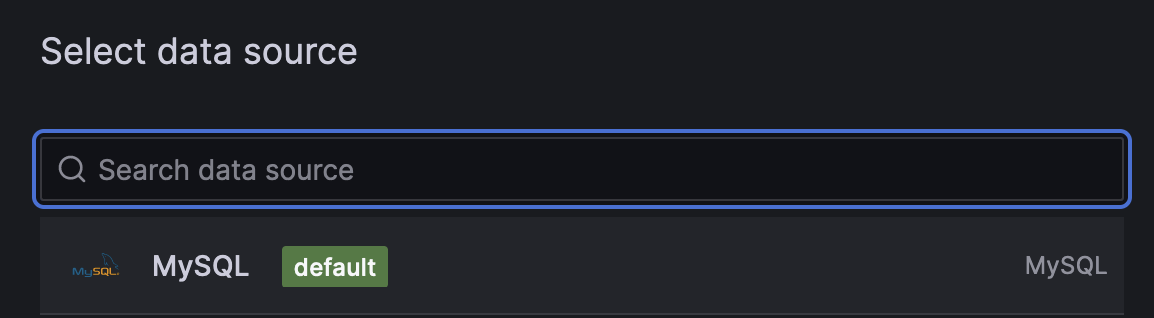
- Choose the datasource with Manticore Search that connected by using MySQL connector.
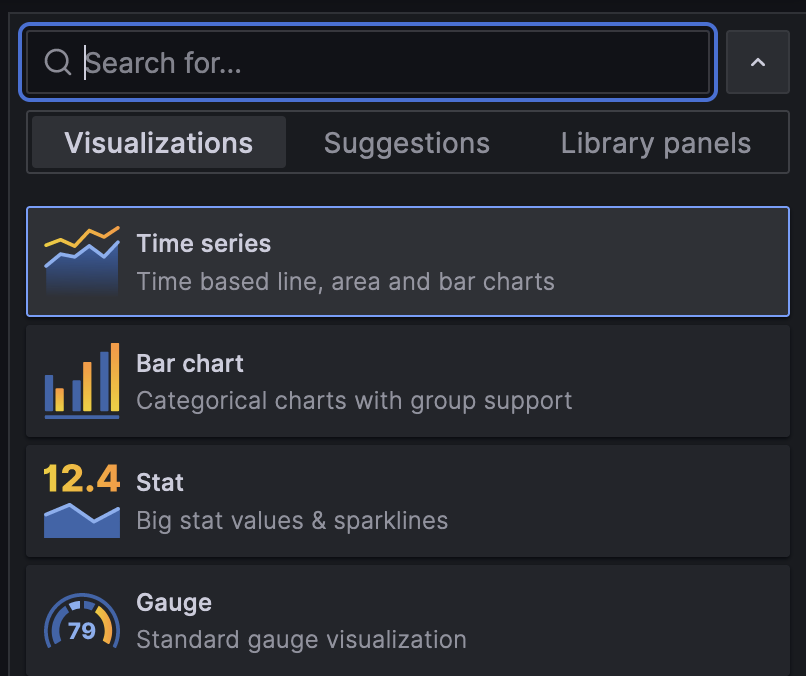
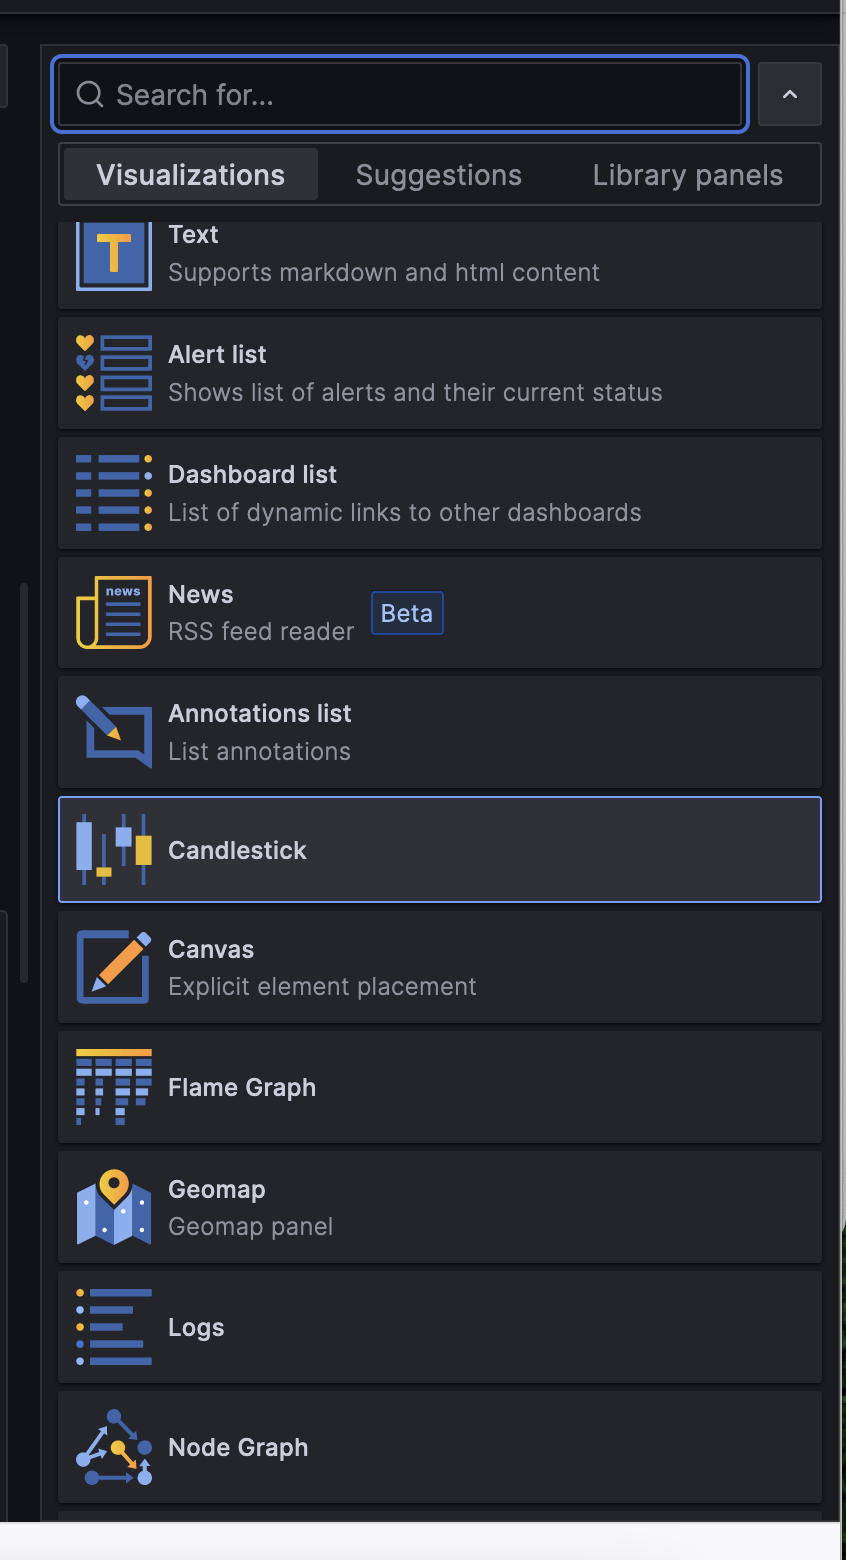
- Choose the type of chart you want to create (e.g., bar chart, line chart, pie chart) from the list of available visualization options. We will choose “Time Series”.
Step 6: Configure the Chart
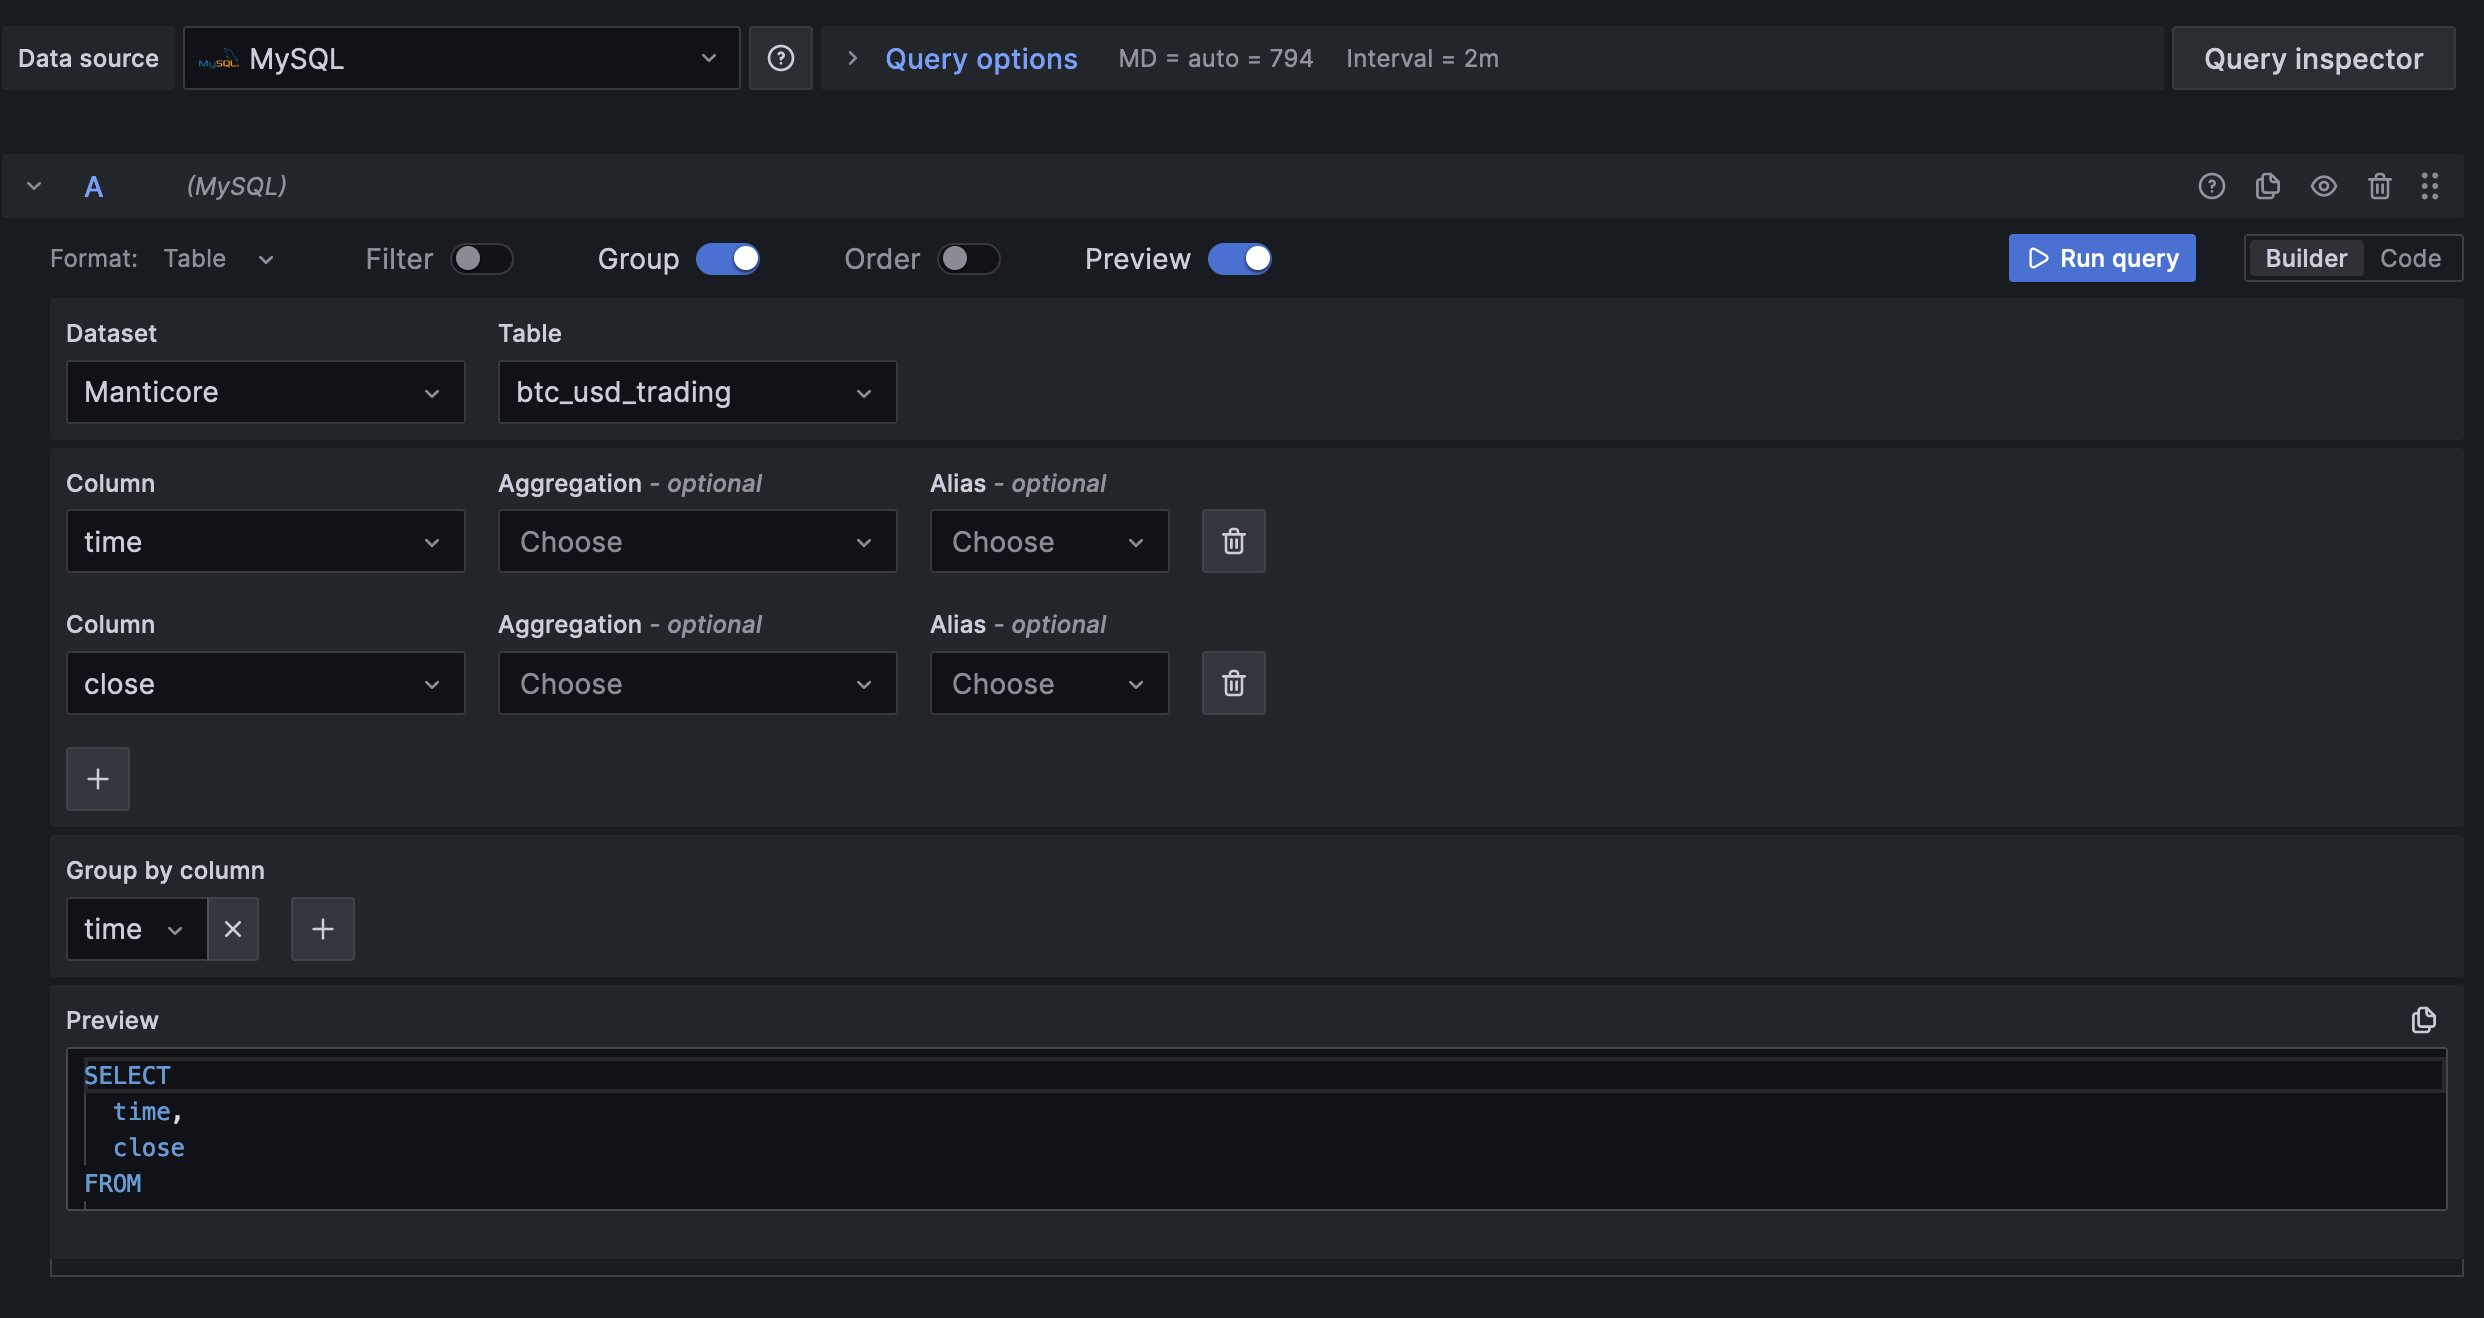
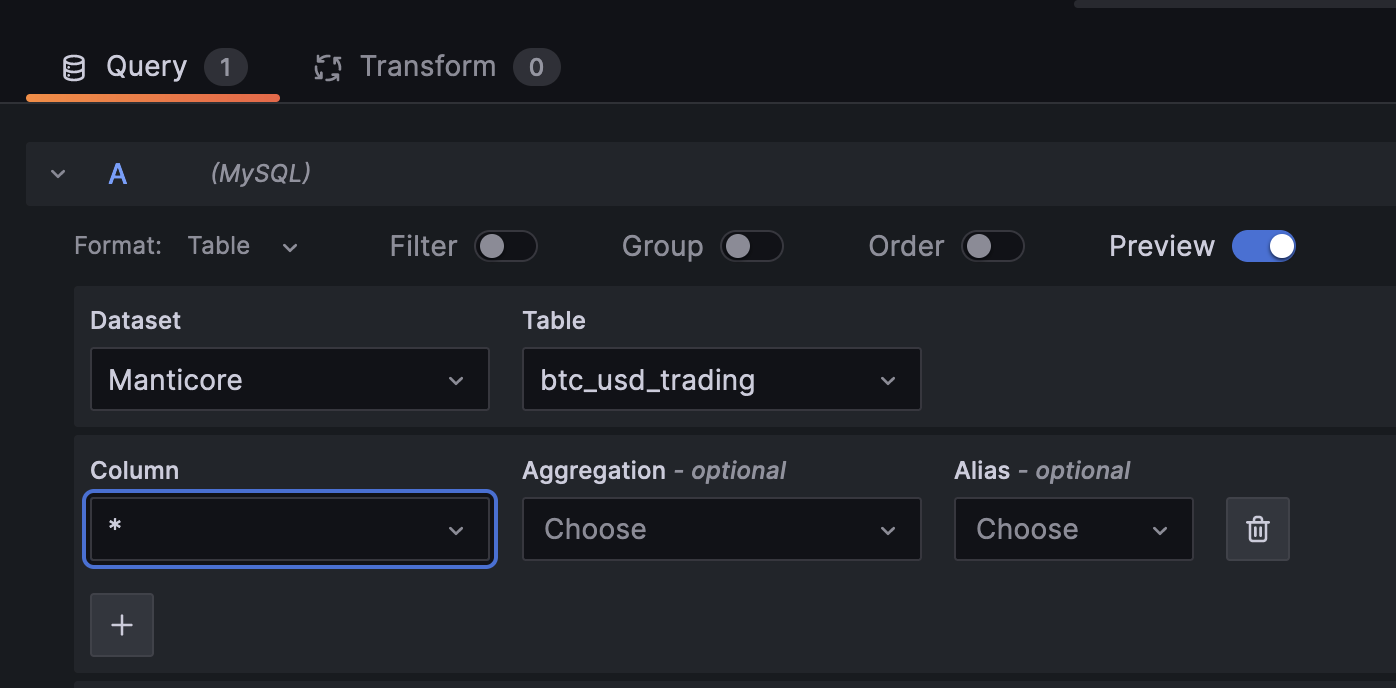
- Use Grafana’s query builder or simply write an SQL query to fetch the data you want to visualize from your Manticore Search database.
- Customize the chart’s appearance, labels, and other settings as needed.
- Click on “Apply” to save your chart.
Step 7: Check your chart’s result
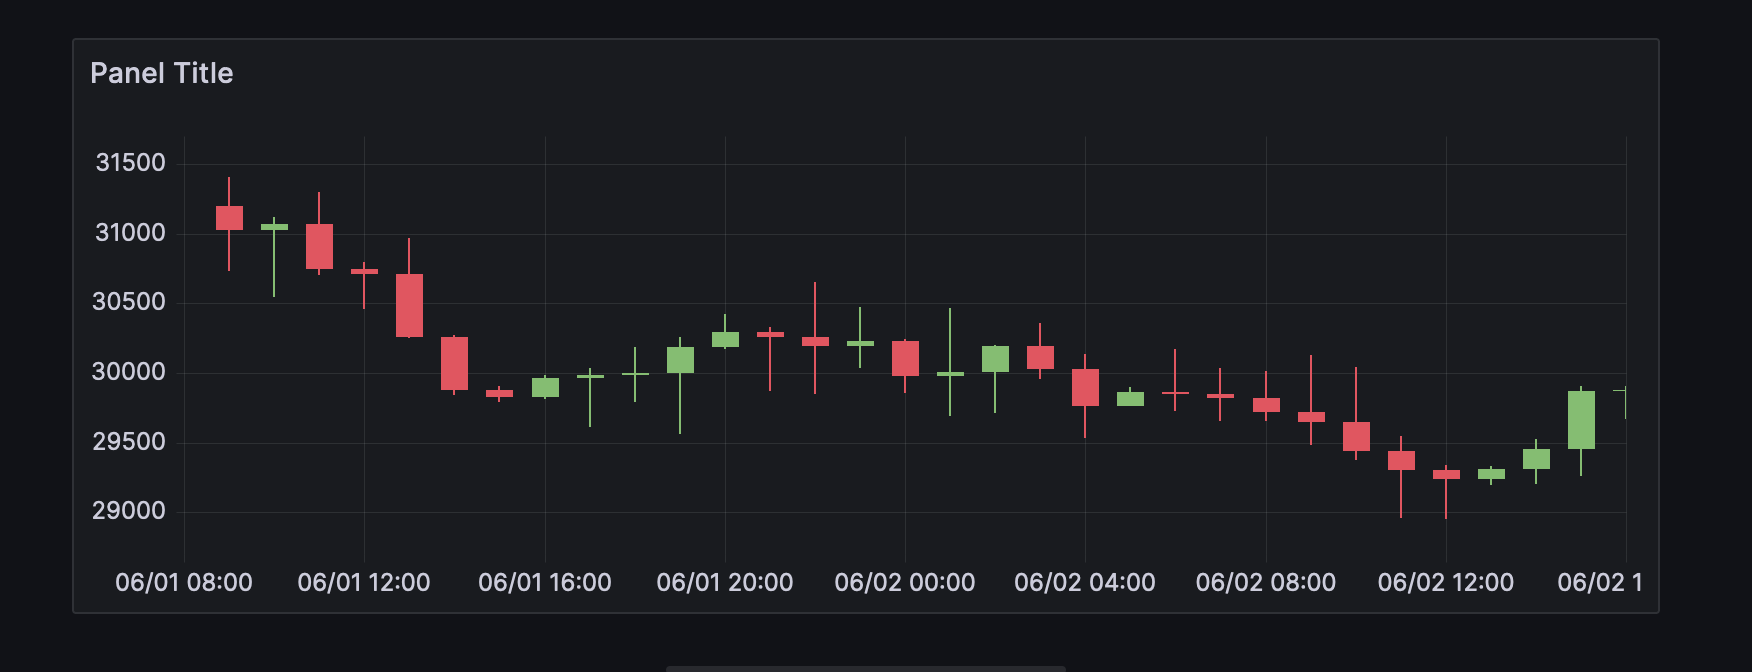
Here is a sample of the results we obtained by using the provided data.
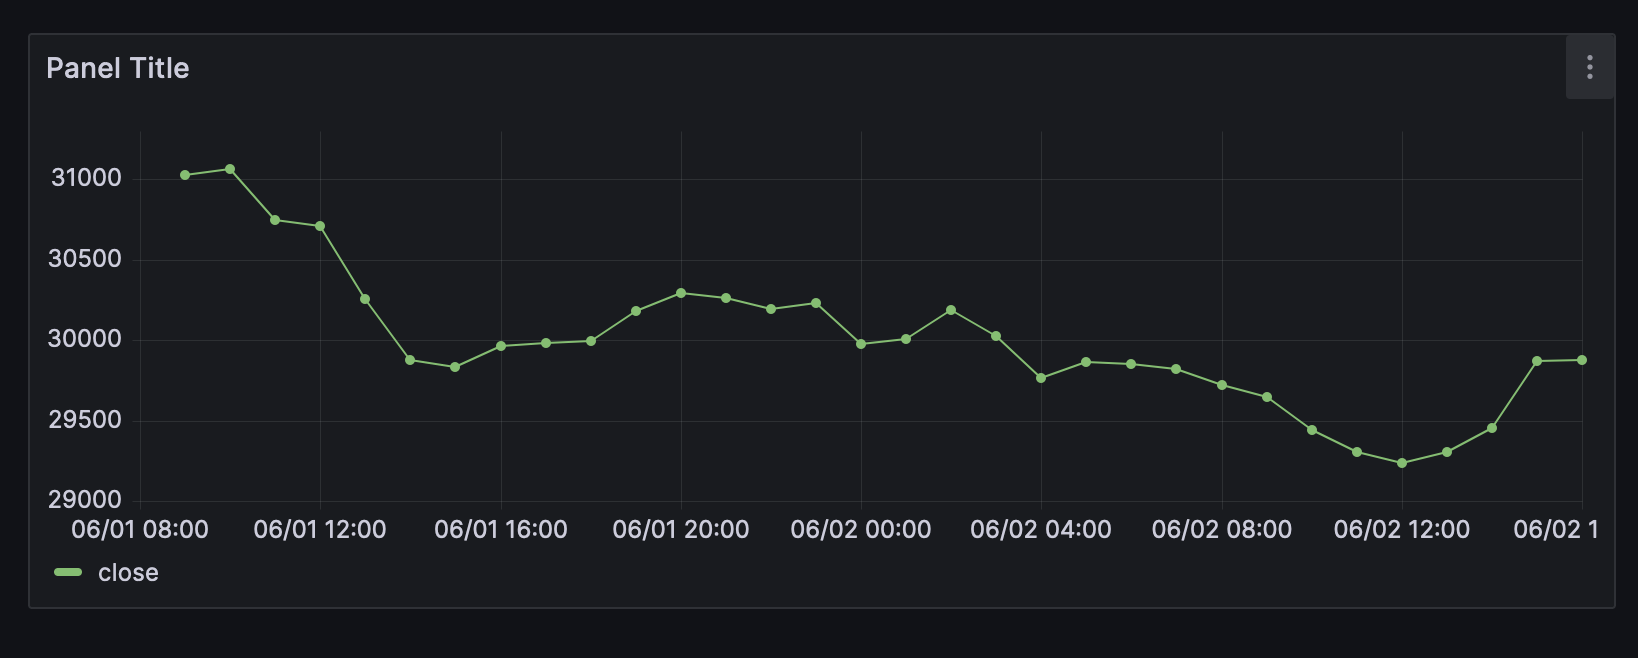
It’s easy to change the style of a chart, as in this example, we used Bitcoin prices. Simply choose Candlestick and adjust the query builder by selecting all fields. This will provide an entirely different view of your data in Grafana.
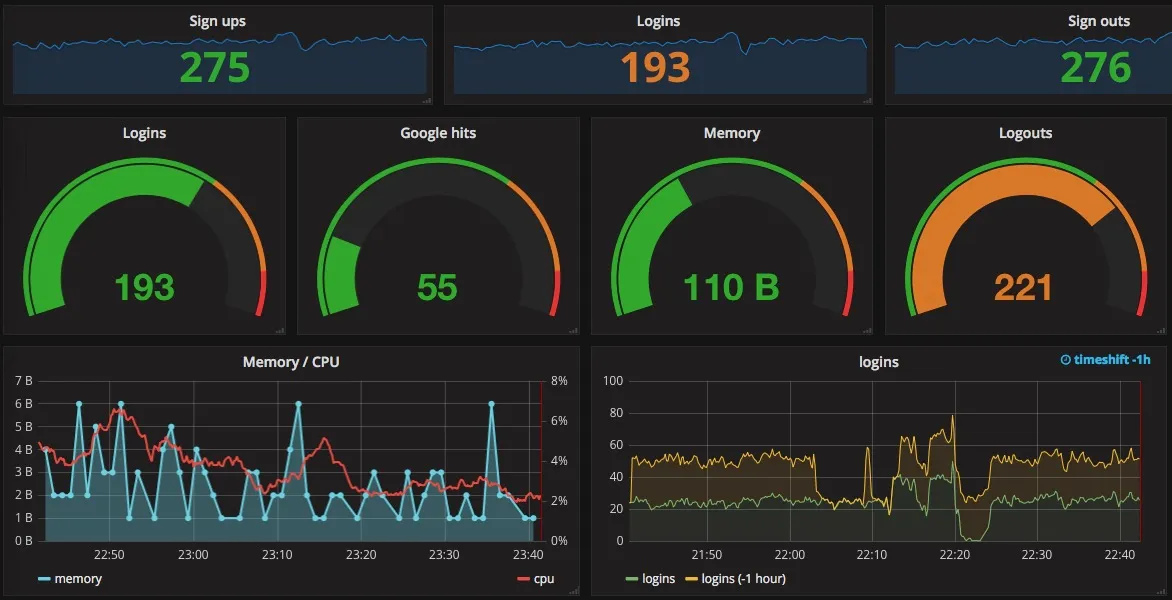
You can also use different types of visualizations available in Grafana, depending on the data in your Manticore Search database. Simply connect your Manticore Search, select the table, and create a chart with the desired parameters using the default MySQL connector.
Build your own dashboard by combining different charts of your data!
Conclusion
With the seamless integration of Manticore Search and Grafana using the default MySQL connector, you can now unlock the full potential of your search data. Visualize trends, performance metrics, and real-time insights with ease, all within the intuitive Grafana interface. Get started today and elevate your data analysis capabilities to new heights.